Tag: basics of mass photometry

  • How to study membrane proteins with mass photometry

    How to study membrane proteins with mass photometry

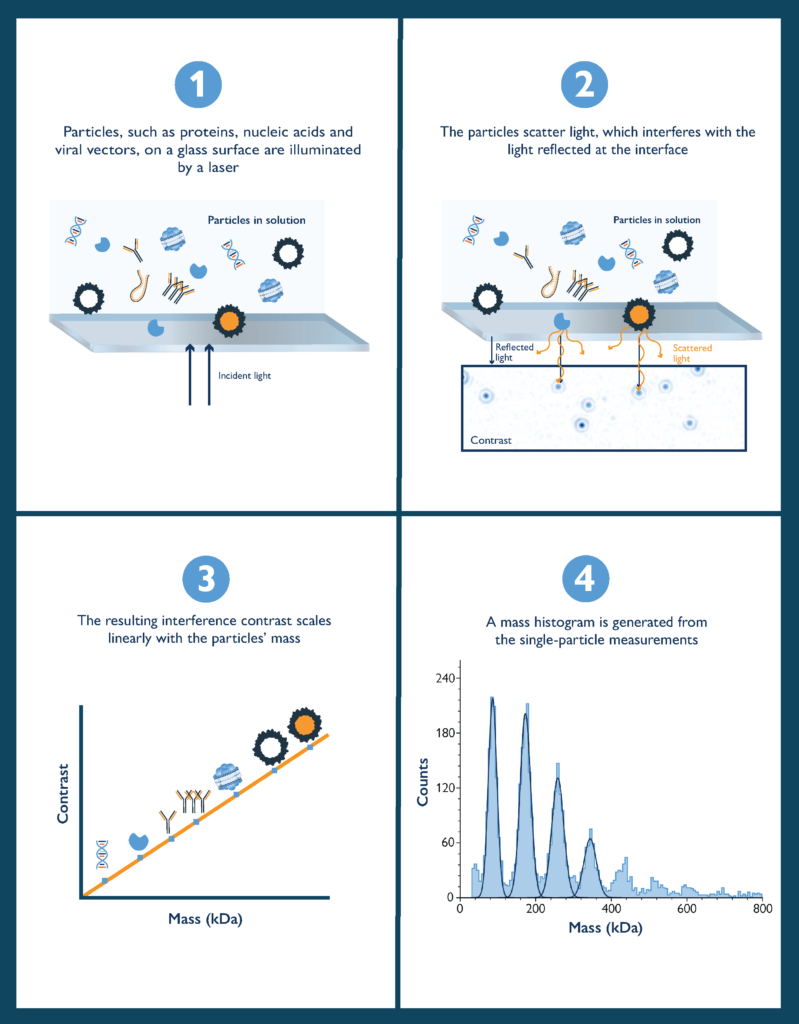
    The biologically important membrane proteins remain a challenging target for structural and functional studies, despite recent advances in biomolecular characterization capabilities. This is due to intrinsic difficulties in expressing, purifying and preparing membrane proteins for analysis while preserving their structure and activity. 

    Mass photometry is a powerful biomolecular characterization technology that can help overcome these difficulties. Mass photometry provides high-resolution information on the mass distribution of particles in solution at the single-molecule level. It requires no labels and very little sample, and gives results in a matter of minutes. 

    Moreover, mass photometry can be used to measure samples with membrane mimetics [1], such as:

    • Detergents 
    • Nanodiscs 
    • Styrene maleic acid lipid particles (SMALPs)
    • Amphiphilic polymers (amphipols)

    Mass photometry provides valuable information on the purity and behavior of samples containing membrane proteins and membrane mimetics, including:   

    • Aggregation, helping make sure membrane proteins are correctly solubilized
    • Oligomerization state of solubilized membrane proteins under different experimental conditions
    • Equilibrium states of two or more components in a sample
    • Interaction dynamics

    In this blog post, we examine the role of mass photometry in membrane protein analysis and describe case studies that illustrate how mass photometry is contributing to the field.

    In case you’re interested in learning how mass photometry can help with your specific application, get in touch.

    ——————————

    Outline 

    • Mass photometry and detergents 
    • Mass photometry and cryo-EM 
    • Mass photometry for nanodisc assessment 
    • Mass photometry and amphipols 
    • Outlook  
    • Further resources 
    • References 

    ——————————

    824bf4_8b333e8023b843be956c407a0dce974f~mv2.jpg.webp

    Mass photometry can be used to measure proteins in samples containing detergents. Mass photometry is a versatile and fast method, and experimental protocols can be adjusted to work around the noise introduced by detergent molecules and micelles. See the application notefor more details on how to use mass photometry to measure samples containing detergent and optimize your experimental conditions

    ——————————

    Mass photometry and detergents 

    Working with detergents is notoriously difficult and represents a major obstacle in membrane protein characterization. Detergents increase sample heterogeneity and can have very different behaviors in slightly different experimental conditions. In addition, some analytical techniques are incompatible with the use of detergents. 

    Mass photometry is sensitive enough to measure proteins and protein-micelle complexes within detergent-containing samples and works in samples containing a wide variety of detergents and buffers. Moreover, its low time and sample requirements vastly reduce the cost of the unavoidable trial and error involved in using detergents.

    An example showcasing the strengths of mass photometry for the study of membrane proteins in detergent can be found in a 2021 study by Paul Weiland and Florian Altegoer from the University of Marburg, which provided valuable insights about the membrane proteins involved in infection in the corn fungal pathogen Ustilago maydis [2]. U. maydis can have severe impacts on cereal crops and relies on specialized membrane proteins for the infection process, but little was known about the identities of those membrane proteins or how they worked. 

    Weiland and Altegoer screened six genes known to be upregulated in the fungus during infection of the host and identified two that significantly reduced virulence when deleted. They named the transmembrane proteins encoded by these two genes “Virulence-associated membrane proteins (Vmp) 1 and 2” and characterized them using a variety of methods, including mass photometry.  

    The authors used mass photometry to determine the oligomerization state of Vmp1 and Vmp2 in near-native conditions, using a fast in-drop dilution procedure to minimize the noise introduced by the detergents needed to solubilize them. Moreover, with mass photometry, they were able to measure the effects of different protein concentrations and detergent types on the oligomerization state of both proteins (Fig. 1).   

    The initial identification and characterization of two U. maydis proteins opens the way to further research on the infection process of this fungal pathogen. Mass photometry was a key part of the analysis, and this example demonstrates how it can be used as a standalone technique to extract information on membrane proteins and work around the complications that result from using detergents.  


    824bf4_a53fd8fb205842938a465116865135f2~mv2.jpg.webp

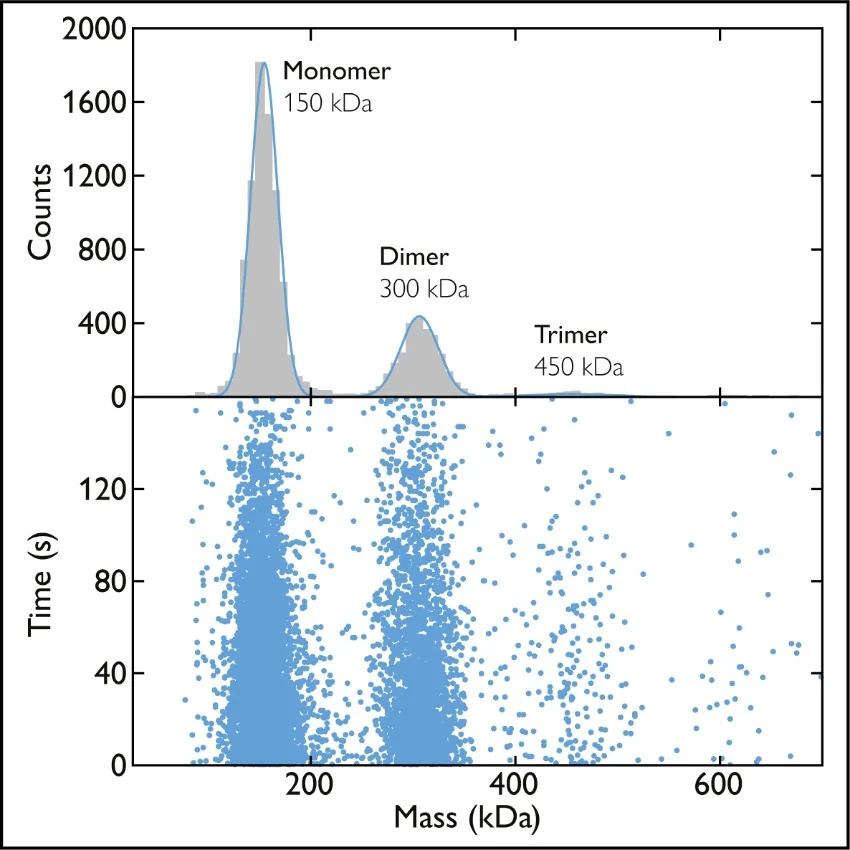
    Fig. 1 Mass photometry measurements of U. maydis virulence-associated membrane proteins in detergent. Left plot shows the mass distribution for 25 nM Vmp1 samples solubilized in the detergent LDAO. A measured mass of close to 42 kDa suggests Vmp1 exists as monomers. Right plot shows the mass distribution of 100 nM Vmp2 samples solubilized in the detergent LDAO. A measured mass of 81 kDa indicates Vmp2 exists mainly as dimers. Adapted from figures 5 and 6 in [2]. 

    ——————————

     Mass photometry and cryo-EM 

    Recent improvements in cryogenic electron microscopy (cryo-EM) have allowed researchers to reconstruct the 3D structures of proteins in exquisite detail, going so far as ‘catching them in the act’ of performing their functions. However, even with cryo-EM, membrane proteins remain tricky to analyze. Finding the optimal detergents and their concentrations is critical for the success of experiments, but can turn into a time-consuming task that leaves one ‘waiting helplessly until the end of image processing to know if the optimization efforts have improved the situation or not’ [3].  

    Here is where mass photometry can help. As each measurement takes only a few minutes and little sample, it can be used to efficiently test different experimental conditions. We see an example in the first lecture of this webinar, where Dr. Oliver Clarke from Columbia University describes his team’s efforts to characterize the Ankyrin-1 membrane complex from red blood cells[TS1] [4].

    The researchers’ aim was to obtain the structure of the Ankyrin-1 complex using cryo-EM. However, they first needed to find detergents that were compatible with purification and did not destabilize the complex. Mass photometry enabled them to identify the correct detergent for the analysis, which in this case was digitonin.


    824bf4_b64627b2f2ae43aaa06ad0f0477ef6b5~mv2.jpg.webp

    Mass photometry can be applied to samples containing nanodiscs. Thanks to its high sensitivity, mass photometry provides detailed information on the proportions of empty and full nanodiscs, as well as the oligomerization state of the protein within them. Moreover, a short measurement time speeds up the process of finding out which proportions of lipids, scaffold proteins and target proteins are optimal for sample preparation [1]. 

    Another recent structural study further highlights the use of mass photometry within cryo-EM analytic pipelines. Beenken and colleagues [5] resolved the structure of the low-density lipoprotein receptor-related protein 2 –LRP2, also known as megalin – at extracellular and endosomal pH. The results revealed that the LRP2 is open to its ligand at extracellular pH but that its structure changes in response to endosomal pH, releasing the ligand. Such a system results in efficient ligand delivery and receptor recycling. 

    Beenken et al. used mass photometry in combination with sedimentation velocity analytical ultracentrifugation (SV-AUC) and SEC-MALS to examine the oligomeric state of LRP2. All three techniques gave similar results, showing a single population of particles of ≈ 1.2 MDa corresponding to stable LRP2 homodimers.  The free detergent present in the sample was detected on mass histogram as a small population with low molecular weight, however it did not interfere with the LRP2 characterization.

    ——————————

     Mass photometry for nanodisc assessment 

    In addition to detergents, membrane mimetics such as nanodiscs, SMALPs and amphipols are used to stabilize membrane proteins in solution for analysis. As with detergents, it is critical to find the optimal conditions for the experiment, and mass photometry can again help to expedite the process.  

    A clear demonstration of the use of mass photometry to evaluate nanodisc assembly and membrane protein integrity can be found in a recent study by Olerinyova and colleagues [1]. Here, the authors tested several sample preparations to integrate the potassium channel KcsA from Streptomyces lividans into nanodiscs.  

    Although two of the preparations had almost identical size exclusion chromatography (SEC) profiles, mass photometry revealed that KcsA was properly assembled into tetramers within the nanodiscs in only one of them. Functional analysis confirmed that only the preparation containing tetramers showed protein activity, demonstrating that mass photometry can provide critical information for nanodisc structural and functional studies that may not be available through other techniques.  

    ——————————

    Mass photometry and amphipols

    Another use case of mass photometry can be found in a very interesting work by Webby et al. [6]. This paper looks at the organization of outer membrane proteins (OMPs) in E. coli. Using a combination of cross-linking assays and computer modeling, they determined that outer membrane proteins are not individually and randomly distributed over the membrane surface – the classical view. Instead, protein-lipid-protein interactions form large complexes that cover the membrane in a sort of lattice that serves as structural support.  

    Mass photometry was used to study complex formation between outer membrane proteins OmpF and BtuB, as their interaction did not survive native mass spectrometry analysis. Outer membrane proteins were solubilized using a detergent and, prior to mass photometry, they were transferred to amphipols. Mass photometry revealed that OmpF and BtuB form a heterogenous ensemble of complexes with different stoichiometries in solution. 

    ——————————

    Outlook 

    The case studies above show that mass photometry has an important role to play in the study of membrane proteins, either by itself or as part of a battery of analytical techniques. Structural biology, for instance, increasingly relies on multiple approaches working in tandem [5] and mass photometry will become an important component of biophysical analysis pipelines [6], [7]. Meanwhile, mass photometry and its applications continue to evolve, for example with the recent introduction of automated mass photometry. The emerging use of mass photometry for dynamic membrane protein tracking [8], [9] suggests that the technology’s applications in membrane protein analysis will further grow. More broadly, mass photometry’s versatility, speed and ease of use position it as a staple technology for membrane protein analysis.  

    ——————————

    Further resources:  

    To learn more about using mass photometry for the study of membrane proteins we recommend:  

    Blog – Mass photometry: a new way of characterizing biomolecules  

    Here you can learn about the basics of mass photometry and the main advantages it offers for the analysis of biomolecules.  

    Webinar – Investigating membrane protein complexes with mass photometry 

    This webinar is the source of two of the case studies presented. In the first talk, Dr. Oliver B. Clark, an assistant professor at Columbia University talks about his work on the structural characterization of the red blood cell Ankyrin-1 complex. He shows how mass photometry has helped find the optimal experimental conditions for Cryo-EM analysis of Ankyrin-1.  

    In the second talk, Dr. Andrea Saponaro, a PI at the University of Milan, explains his study of the structure of the HCN pacemaker and its interactions with regulators such as cAMP and TRIP8b. He talks about how mass photometry has helped determine the stoichiometry of the interaction between HCN1 and the full-length TRIP8b protein.  


    Webinar: Measuring Membrane Proteins with Mass-Sensitive Particle Tracking 

    In this webinar, Dr Nikolas Hundt (Ludwigs-Maximilian-University Munich), describes a new mass photometry strategy for tracking unlabeled molecules diffusing on supported lipid bilayers. With this approach, called mass-sensitive particle tracking (MSPT), researchers can determine the mass distributions and diffusion characteristics of membrane-associated protein complexes and observe protein assembly dynamics on a lipid interface in real time. 

    Application note: Mass photometry with detergents 

    This note describes in detail how to use mass photometry to measure samples containing detergents, including possible issues and workarounds.  

    ——————————

    References:  

    [1] A. Olerinyova et al., “Mass Photometry of Membrane Proteins”. Chem, vol. 7, no. 1, pp. 224–236, Jan. 2021, doi: 10.1016/j.chempr.2020.11.011. 

    [2] P. Weiland and F. Altegoer, “Identification and Characterization of Two Transmembrane Proteins Required for Virulence of Ustilago maydis”. Frontiers in Plant Science, vol. 12, p. 669835, May 2021, doi: 10.3389/fpls.2021.669835. 

    [3] Y. Cheng, “Membrane protein structural biology in the era of single particle cryo-EM”. Current opinion in structural biology, vol. 52, pp. 58–63, Oct. 2018, doi: 10.1016/j.sbi.2018.08.008. 

    [4] F. Vallese et al., “Architecture of the human erythrocyte ankyrin-1 complex”. Nature Structural & Molecular Biology, vol. 29, no. 7, Art. no. 7, Jul. 2022, doi: 10.1038/s41594-022-00792-w. 

    [5] A. Beenken et al., “Structures of LRP2 reveal a molecular machine for endocytosis.” Cell vol. 186, no. 4 p. 821 Feb. 2023, doi: 10.1016/j.cell.2023.01.016.

    [6] M. N. Webby et al., “Lipids mediate supramolecular outer membrane protein assembly in bacteria.” Science Advances vol. 8, no. 44 p. eadc9566, doi: 10.1126/sciadv.adc9566.

    [7] A. C. Steven and W. Baumeister, “The future is hybrid”. Journal of Structural Biology, vol. 163, no. 3, pp. 186–195, Sep. 2008, doi: 10.1016/j.jsb.2008.06.002.. 

    [8] S. Niebling et al., “Biophysical Screening Pipeline for Cryo-EM Grid Preparation of Membrane Proteins”. Frontiers in Molecular Biosciences, vol. 9, 2022, Accessed: Jul. 01, 2022. [Online]. doi: 10.3389/fmolb.2022.882288 

    [9] Y. Xu and S. Dang, “Recent Technical Advances in Sample Preparation for Single-Particle Cryo-EM.” Frontiers in Molecular Biosciences vol. 9 Jun. 2022, doi: 10.3389/fmolb.2022.892459. 

    [10] E. D. B. Foley, M. S. Kushwah, G. Young, and P. Kukura, “Mass photometry enables label-free tracking and mass measurement of single proteins on lipid bilayers”. Nature Methods, vol. 18, no. 10, Art. no. 10, Oct. 2021, doi: 10.1038/s41592-021-01261-w. 

    [11] T. Heermann, F. Steiert, B. Ramm, N. Hundt, and P. Schwille, “Mass-sensitive particle tracking to elucidate the membrane-associated MinDE reaction cycle”. Nature Methods, vol. 18, no. 10, pp. 1239–1246, Oct. 2021, doi: 10.1038/s41592-021-01260-x. 

  • Making sense of mass photometry measurements

    Making sense of mass photometry measurements

    This post was first published in November 2021 

    Updated on 15th August 2025 

    Mass photometry is a way to measure the mass of biomolecules and small viral capsids in solution without labels. It works by quantifying the interference between the light scattered by an individual molecule in contact with a measurement surface and the light reflected by that surface. The resulting signal – or contrastis directly proportional to the molecule’s mass [1], [2] (read more about how mass photometry works).   

    The single-molecule nature of mass photometry makes it a powerful bioanalytical technique. It allows you to detect and quantify different populations of species in a sample. For example, it can be used to quantify protein oligomers (monomers, dimers, trimers, etc.) (see Fig. 2 below), to characterize protein-protein interactions and calculate binding affinities, and to quantify populations of empty, partially filled and full adeno-associated virus (AAV) capsids.  

    Mass photometers report the data they obtain – profiles of the mass distribution of the components of a sample – as histograms. Knowing how to interpret a mass histogram is essential for making sense of mass photometry. Here, we explain how mass histograms are generated, and how to read and understand them.   

    How do mass photometers analyze data?

    Mass photometry data is simply a series of images (Fig. 1). For each image in the series, the average of N frames is taken and divided by the average of the N subsequent frames to reveal how much the signal changed when a particle landed on the glass surface. When molecules and other small particles land on the glass surface, they produce signals in these ratiometric frames that are detected and counted. These signals are reported in the mass histogram.  

    Schematic showing how individual video frames of mass photometry measurements are processed to detect particle landing events

    Figure 1 Generation of the mass photometry signal. Images of the glass surface, taken over time, are divided into two stacks of N consecutive frames (typically N=5)These stacks are averaged to calculate a single ratiometric frame. The process is repeated for stacks of frames shifted by one frame at a time, generating a ratiometric movie that shows when particles land on the glass surface as well as their contrast signal. 

    What information is available in a single mass peak?

    The typical mass photometry measurement lasts for one minute, and hundreds to thousands of landing events can be detected by the mass photometer during that time. Histograms are a helpful way to visualize those many single-molecule measurements (Fig. 2). 

    Example of a mass photometry histogram that shows data from the measurement of an antibody with several oligomeric forms

    Figure 2 Mass photometry data of a sample of the antibody 2G12.The scatter plot (bottom) shows the mass measurements associated with the many landing events recorded over a 160-second time period. The mass photometry histogram (top) presents the data as a histogram, with the peaks fit by Gaussian curves. In this example, the peaks correspond to monomers, dimers and trimers of 2G12 IgG, a monoclonal antibody against the HIV envelope glycoprotein gp120. 

    In histograms, the measurements of single-particle landing events are grouped into narrow mass ranges (‘bin’) to make the data easier to interpret. Each bin is represented by a vertical bar, and the height of the bar (the ‘counts’) tells you how many measurements fell into that particular range. If a bar is tall, it means that the mass photometer counted many landing events within that mass range.  

    As for most biological data, repeated measurements of molecules with the same mass will produce data with some variability that is centered on the true value. In a mass photometry histogram, such data will appear as peaks made up of several bars. Each peak can be fit by a Gaussian curve (Fig. 2) – a straightforward statistical approach that is implemented in DiscoverMP, the custom-built data analysis software that works with Refeyn’s mass photometry instruments.  

    This fitting yields two key values: The mean of the peak and its standard deviation. The mean is the mean mass of the particles whose data formed the peak, while the standard deviation indicates how spread out the values are – an indicator of the uncertainty in the measurement.  

    Interpreting multiple mass peaks

    Often, a mass photometry histogram will have multiple peaks, indicating that there are multiple species present in the sample. Indeed, the single-molecule nature of mass photometry means that you can characterize samples containing many different species across a broad mass range. The different species can be detected provided they differ enough in mass (the mass differences must be above the resolution of the instrument – learn more about mass photometry resolution).  

    As an example consider a sample containing the antibody 2G12, which is known to form oligomers. In the histogram, we can see three peaks, indicating that there were three protein species, each with different mass, in the sample (Fig. 2). From the mean of each peak (which tells us the mass of the molecules in that subpopulation), we can conclude that the peaks correspond to 2G12 monomers, dimers and trimers.  

    We can also use the mass histogram information to assess the relative abundance of the different species detected. Already, from just a quick glance at the sizes of the peaks, we can see that the monomers were the most abundant, followed by dimers and then trimers. But going beyond that quick glance, by looking at the number of counts that contributed to each peak, we can quantify those abundances. 

    You can even use the information on the relative abundances to determine proteins’ binding affinities [3]. 

    Example: A mass photometry histogram for bispecific antibody binding

    There are numerous examples in the literature of mass photometry being used for protein characterization, including in research into hemoglobin scavenging [4], R2TP chaperones [5], antifungal drug targets [6] and many other areas. It is also increasingly used to study other types of biomolecules like nucleic acids [7] and AAVs [8].  

    Mass photometry gives a detailed overview of the contents of a sample while requiring little time investment and sample consumption. These strengths make it especially useful in the context of pharmaceutical development, where critical quality attributes of samples need to be frequently characterized. Here we show an example  – extracted from a larger collaboration with Absolute Antibody – of what information a mass photometry histogram can provide. 

    Fig. 3 shows mass photometry analyses of samples of a bispecific antibody mixed with the HER2 antigen – one of its targets – at five different concentrations. At each concentration, the mass photometry histograms showed each of the isolated components of the sample (the antibody and antigen), as well as antibody-antigen complexes with different stoichiometries. As mass photometry also quantifies the relative proportions of each species, it is possible to calculate the binding affinities of the different complexes present in the sample, even in cases where multiple interactions are present.  

    A series of histograms showing mass photometry measurement of a bispecific antibody and one of its antigens at different concentrations

    Figure 3 Mass photometry resolves complex bsAb-antigen interactions. The concentration of bsAb-A was kept constant at 5 nM, while the HER2 concentration was varied (0.0, 2.5, 5.0, 10 and 20 nM). Mass photometry histograms (measured at equilibrium) show peaks and corresponding counts for each individual species as well as 1:1 HER2-bsAb complexes and 2:1 HER2-bsAb complexes. As the HER2 concentration increases, the peaks corresponding to free antigen and the 2:1 complex become more prominent, indicating that populations of those species are increasing. 

    In summary

    • Mass photometry is a powerful bioanalytical method which allows the characterization of biomolecules and small viral capsids on a single-particle level.  
    • Mass photometry data are typically presented as histograms, where each peak of the histogram represents a population with a particular mass.  
    • Analysis of the peaks yields the mass of each population and its relative abundance.  

    Further resources

    If you would like to learn more about mass photometry, we recommend the following resources: 

    Webinar: Quantifying protein-protein interactions by molecular counting with mass photometry 

    Fabian Soltermann from the University of Oxford talks about his work on mass photometry and the quantification of protein-protein interactions in antibody-antigen systems. Fabian shows how we go from counting single molecules with mass photometry to obtaining information on the purity of samples, as well as on stoichiometry, affinity and binding kinetics.  

    The TwoMP mass photometer 

    Refeyn’s TwoMP mass photometer is optimized for characterizing proteins and nucleic acids, as well as their interactions. With its high sensitivity, the TwoMP is ideally suited for measurements at physiological (i.e. low) concentrations, with measurements at higher concentrations enabled by the MassFluidix HC add-on. The high dynamic range intrinsic to single molecule counting techniques ensures low-abundance species are still captured accurately.  

    References

    [1] G. Young et al., ‘Quantitative mass imaging of single biological macromolecules’, Science, vol. 360, no. 6387, pp. 423–427, Apr. 2018, doi: 10.1126/science.aar5839. 

    [2]  G. Young and P. Kukura, ‘Interferometric Scattering Microscopy’, Annu. Rev. Phys. Chem., vol. 70, no. 1, pp. 301–322, Jun. 2019, doi: 10.1146/annurev-physchem-050317-021247. 

    [3] F. Soltermann et al., ‘Quantifying Protein–Protein Interactions by Molecular Counting with Mass Photometry’, Angew. Chem. Int. Ed., vol. 59, no. 27, pp. 10774–10779, 2020, doi: 10.1002/anie.202001578. 

    [4] S. Tamara, V. Franc, and A. J. R. Heck, ‘A wealth of genotype-specific proteoforms fine-tunes hemoglobin scavenging by haptoglobin’, Proc. Natl. Acad. Sci., vol. 117, no. 27, pp. 15554–15564, Jul. 2020, doi: 10.1073/pnas.2002483117. 

    [5] T. V. Seraphim et al., ‘Assembly principles of the human R2TP chaperone complex reveal the presence of R2T and R2P complexes’, Structure, vol. 0, no. 0, Sep. 2021, doi: 10.1016/j.str.2021.08.002. 

    [6] S. M. H. Chua et al., ‘Structural features of Cryptococcus neoformans bifunctional GAR/AIR synthetase may present novel antifungal drug targets’, J. Biol. Chem., p. 101091, Aug. 2021, doi: 10.1016/j.jbc.2021.101091. 

    [7] Schmudlach A, et al., ‘Mass photometry as a fast, facile characterization tool for direct measurement of mRNA length’, Biology Methods and Protocols, Biol. Methods Protoc., 2025;10(1):bpaf021, doi:10.1093/biomethods/bpaf021 

    [8] C. Wagner et al., ‘Quantification of empty, partially filled and full adeno-associated virus vectors using mass photometry’, Int. J. Mol. Sci., 3;24(13):11033, Jul. 2023, doi: 10.3390/ijms241311033. 


  • Understanding the strengths and boundaries of mass photometry (2025)

    Understanding the strengths and boundaries of mass photometry (2025)

    This post was first published in October 2021

    Updated on June 2025 

    Mass photometry is an analytical method that measures molecular mass by quantifying light scattering from individual biomolecules and particles in solution. It was introduced in a 2018 publication in the journal Science (Young et al., 2018). Since then, more and more scientists have been turning to mass photometry to analyze sample purity, interactions, aggregation and much more. Fast, versatile and easy to use, it has now been adopted by hundreds of labs around the world and referenced in over 1000 scientific publications

    If you are evaluating mass photometry as a potential technology for your lab, you will first want to assess whether its capabilities align with your sample types and needs 

    Here, we describe mass photometry’s mass range, resolution and experimental error, and the concentration ranges that can be analyzed. 

    Mass range

    Because mass photometry simply measures light scattering, it should be possible to measure any particle within the appropriate mass range. Indeed, the technique has been used to study samples containing a diverse range of different biomolecules and other particles, such as: 

    With the TwoMP mass photometer, you can reliably measure molecular mass in the range from 30 kDa to 5 MDa (Fig. 1). The range of the SamuxMP mass photometer, which is optimized for AAV analysis, is 500 kDa to 6 MDa. A related technology, macro mass photometry, can be used to analyze particles of diameter in the 40 – 150 nm range, such as adenovirus, lentivirus and virus-like particles (VLPs).  

    A chart showing the mass and diameter ranges for mass photometry and macro mass photometry. The mass range (30 kDa to 6 MDa) includes proteins and complexes, macromolecular assemblies, nanostructures, RNA, dsDNA, and small viruses (AAVs). The diameter range (40 nm to 150 nm) includes large viral vectors and virus-like particles.

    Figure 1:  Diagram illustrating the mass range and examples of particles that can be analyzed with mass photometry and macro mass photometry 


    Resolution

    Resolution, in mass photometry, is the smallest difference in mass that you can detect in a mass photometry measurement. In other words, it is the smallest difference in mass that resolves as two distinguishable peaks in a mass photometry histogram.  

    There is no single value that defines the resolution of mass photometry because it depends on several factors, including:   

    • The mass range of the particles of interest,  
    • The purity of the sample, and  
    • The relative concentrations of species in the sample.  

    We can take the TwoMP mass photometer as an example to illustrate how the minimum separable distance increases for species with greater mass. At the lower end of the mass range, the resolution is ± 25 kDa for a measurement of a 66 kDa biomolecule (defined as the Full Width of the peak at its Half Maximum value, or FWHM). This means that you could identify other species present in the sample if they were smaller than 41 kDa or larger than 91 kDa (Fig. 2, top panel). These different species would be visible as distinguishable peaks in the mass histogram obtained from a mass photometry measurement. On the other hand, if all species in the sample were within the range 41 – 66 kDa (or 66 – 91 kDa), only one broad peak would be observed, and it would be made up of counts from all the different species.  

    At the higher end of the mass range, for example around 660 kDa, the resolution is ± 60 kDa FWHM. This means that you would be able to distinguish 660 kDa particles from others if their mass were ≤ 600 kDa or ≥ 720 kDa (Fig. 2, bottom panel).  

    In doubt about whether mass photometry could resolve your species of interest? Get in touch!  

    Resolution mass photometry explanation print

    Figure 2 Resolution in mass photometry. Top: The peaks of two proteins in the lower mass range are resolved. Bottom: A mass histogram for the protein thyroglobulin is used to illustrate the resolution and FWHM in the 500 – 800 kDa mass range. 

    Resolution also depends on sample purity, as well as on the relative concentrations of the species in the sample. For resolution, it is optimal to have equal peak heights. In this case, two peaks can be resolved when the separation between their centers is larger than the sum of half their full width at half maximum (FWHM), as described above. But when one species is much more abundant than another, the minimum separation distance increases. Where impurities are present within the mass window of interest or there is significant sample heterogeneity, these factors can also negatively affect the resolution of a mass photometry measurement.   

    In summary, mass photometry resolution varies across the mass range and can be affected by the composition and quality of a sample. 


    Experimental error

    Mass photometry measures molecular mass with high accuracy. However, as with all analytical methods, you must be aware of possible experimental error.   

    A single mass photometry measurement comes with a measurement error of up to ± 5% (for Refeyn mass photometers), meaning that the molecular mass measured by mass photometry might deviate from the expected molecular mass by ± 5% (Fig. 3). The peaks in a mass photometry histogram can be fitted using Gaussian approximations, with the peak center indicating the measured mass of the species. This experimental error arises from a combination of sources, including sample measurement error, calibrant measurement error and error in fitting a Gaussian curve to the raw data. The error can be reduced by taking the average of repeated measurements. 

    Expected vs measured Mass error print 2

    Figure 3 Accuracy of mass photometry. Top: Correlation of expected vs. measured molecular mass (in kDa) for a set of proteins across the 60 – 1000 kDa mass range. Bottom: Mass error shown as a percentage of the expected mass (N=150). Measured on a OneMP mass photometer


    Sample concentration range

    Mass photometry measures the mass of single particles as they land on a glass measurement surface. To ensure that the landing events are well separated in space and time, it is essential to prepare samples to the appropriate concentration. Mass photometry can be performed with sample concentrations ranging from 100 pM to 100 nM, with the optimal concentration range for biomolecules being 5 – 20 nM for proteins or nucleic acid molecules, and 1011 particles/mL for AAVs.    

    Being able to run mass photometry experiments at such low sample concentrations can be a great advantage when limited sample is available. However, when higher concentrations need to be used, such as if you are studying weak biomolecular interactions of molecular species, a rapid-dilution microfluidics add-on (Refeyn’s MassFluidixTM) can make it possible to measure samples at up to the tens of micromolar.   


    Further resources 

    Blog: How does mass photometry work?  

    Read our technical blog explaining the principle behind mass photometry, how the technology works and what makes it so useful. 

    Handbook: Understanding Mass Photometry 

    Download this handbook for a complete overview of mass photometry – from basics to applications. Everything you need to know to understand how the technology works and how it can be used, all in one place.  

    Webinar: Mastering protein characterization with mass photometry: Key insights & applications by Tomás de Garay, Refeyn 

    Watch this webinar to learn how how mass photometry is transforming protein characterization. It includes a brief introduction to the technology, its applications and how it compares to analytical techniques like cryo-EM, SEC and mass spectrometry, as well as answers to technical questions and practical considerations. Presented by Tomás de Garay, Product Manager at Refeyn.  


    References

    Balakrishnan, S. et al. Structure of RADX and mechanism for regulation of RAD51 nucleofilaments. Proc. Natl. Acad. Sci. 121, e2316491121 (2024). https://www.pnas.org/doi/10.1073/pnas.2316491121  

    Cramer, D. A. T. et al. Characterization of high-molecular weight by-products in the production of a trivalent bispecific 2+1 heterodimeric antibody. mAbs 15, 2175312 (2023). https://doi.org/10.1080/19420862.2023.2175312  

    De Vos, J. et al. Evaluation of size-exclusion chromatography, multi-angle light scattering detection and mass photometry for the characterization of mRNA. J. Chromatogr. A 1719, 464756 (2024). https://doi.org/10.1016/j.chroma.2024.464756  

    den Boer, M. A. et al. Comparative Analysis of Antibodies and Heavily Glycosylated Macromolecular Immune Complexes by Size-Exclusion Chromatography Multi-Angle Light Scattering, Native Charge Detection Mass Spectrometry, and Mass Photometry. Anal. Chem. 94, 892–900 (2021).  https://pubs.acs.org/doi/10.1021/acs.analchem.1c03656  

    Dodge, G. J. et al. Mapping the architecture of the initiating phosphoglycosyl transferase from S. enterica O-antigen biosynthesis in a liponanoparticle. eLife 12, RP91125 (2024). https://doi.org/10.7554/eLife.91125.2  

    Ebberink, E. H. T. M. et al. Probing recombinant AAV capsid integrity and genome release after thermal stress by mass photometry. Mol. Ther. Methods Clin. Dev. 32, (2024).  https://doi.org/10.1016/j.omtm.2024.101293    

    Naftaly, A., Izgilov, R., Omari, E. & Benayahu, D. Revealing Advanced Glycation End Products Associated Structural Changes in Serum Albumin. ACS Biomater. Sci. Eng. 7, 3179–3189 (2021). https://doi.org/10.1021/acsbiomaterials.1c00387  

    Olerinyova, A. et al. Mass Photometry of Membrane Proteins. Chem 7, 224–236 (2021). https://www.sciencedirect.com/science/article/pii/S2451929420305945  

    Schmudlach, A., Spear, S., Hua, Y., Fertier-Prizzon, S. & Kochling, J. Mass photometry as a fast, facile characterization tool for direct measurement of mRNA length. Biol. Methods Protoc. 10, bpaf021 (2025). https://doi.org/10.1093/biomethods/bpaf021  

    Wagner, C., Fuchsberger, F. F., Innthaler, B., Lemmerer, M. & Birner-Gruenberger, R. Quantification of Empty, Partially Filled and Full Adeno-Associated Virus Vectors Using Mass Photometry. Int. J. Mol. Sci. 24, 11033 (2023). https://www.mdpi.com/1422-0067/24/13/11033  

    Wu, D., Hwang, P., Li, T. & Piszczek, G. Rapid Characterization of AAV gene therapy vectors by Mass Photometry. Preprint at https://doi.org/10.1101/2021.02.18.431916 (2021). https://www.nature.com/articles/s41434-021-00311-4  

    Wu, D. & Piszczek, G. Measuring the affinity of protein-protein interactions on a single-molecule level by mass photometry. Anal. Biochem. 592, 113575 (2020). https://www.sciencedirect.com/science/article/abs/pii/S0003269719311686?via%3Dihub  

    Young, G. et al. Quantitative mass imaging of single biological macromolecules. Science 360, 423–427 (2018). https://www.science.org/doi/10.1126/science.aar5839 

  • How does mass photometry work? (2025)

    How does mass photometry work? (2025)

    This post was first published in September 2021

    Updated on 8th May 2025 

    Mass photometry is a bioanalytical technology that measures the mass of individual biomolecules or particles in solution by quantifying light scattering. 

    What is the principle behind mass photometry?

    The principle behind mass photometry is simple: A single molecule on a measurement surface (e.g. a glass coverslip) exposed to a beam of light produces a small but measurable light scattering signal, which is directly proportional to the molecule’s mass. The greater the mass of the molecule, the more intense the signal (Fig. 1). 


    824bf4_a705195ad60e4dfc859b3a08881fbdd6~mv2.jpg.webp


    Figure 1 Mass photometry concept. A biomolecule (light blue) that is exposed to light (yellow) and placed in a mass photometer generates a light-scattering signal (grey circles beneath the biomolecules). The signal’s intensity is correlated with the molecule’s mass. 


    In a mass photometry measurement, a sample of proteins (or other biomolecules or particles) is illuminated with a beam of light. Some of that light is reflected by the measurement surface and some is scattered by molecules on the measurement surface (Fig. 2).   

    Mass photometry measures the interference between the light scattered by the molecule and the light reflected by the measurement surface. The signal measured is called the contrast (or interferometric contrast) and is directly correlated with molecular mass, as demonstrated by the seminal paper introducing mass photometry (Young, et al. 2018). 


    How Mass Photometry Works


    Figure 2 The principle of mass photometry.The light scattered by a molecule in contact with a measurement surface interferes with light reflected by that surface. The interference signal scales linearly with the molecule’s mass. 


    Why mass photometry is useful


    Several valuable benefits set mass photometry apart from other bioanalytical techniques: 

    1. It measures true molecular mass. Mass photometry does not infer the mass indirectly from a different physical parameter. This is different from other techniques, such as dynamic light scattering (DLS) and size-exclusion chromatography (SEC), which infer molecular size from the hydrodynamic radius. Instead, the mass photometry signal measured is directly correlated with the true molecular mass, enabling measurement of the mass of molecules in the range 30 kDa to 6 MDa. 
    2. It shows sample heterogeneity. Mass photometry measures the mass of each molecule or particle on the measurement surface. These single-molecule measurements make it possible to detect subpopulations of species or detail the heterogeneity – aspects of a sample that are invisible to analytical methods that use bulk measurement (such as DLS, SDS-PAGE, analytical ultracentrifugation (AUC) and SEC). 
    3. It works in solution. Mass photometry measurements are performed in solution, and mass photometry is compatible with water as well as a wide range of buffers. Measuring biomolecules in an environment that mimics the intracellular aqueous environment allows their true native behavior to be studied. 
    4.  It uses very little sample. Volumes as little as 10 µL can be enough for a single mass photometry measurement, and the recommended concentration range is 100 pM – 100 nM. The low concentration range means that biomolecules can be studied at concentrations that are physiologically relevant – again helping to mimic the intracellular environment and observe native behavior. A rapid-dilution microfluidics device enables measurement of samples at higher concentrations – up to the tens of micromolar. 
    5. It requires no modification of the sample. Mass photometry does not require any labelling of the molecules or particles under investigation. This simplifies sample preparation and eliminates the risk of labels interfering with native behavior. 
    6.  It provides results rapidly. Mass photometry workflows are very quick, with both sample preparation and measurement together usually taking just minutes. 
    7.  It is easy to use. It takes less than half a day to learn how to do a mass photometry measurement and the data is intuitive to interpret. The instruments also fit conveniently on a lab benchtop. 


    What types of molecules and particles can you measure with mass photometry? 


    Mass photometry is a bioanalytical method suitable for measuring the mass of particles in the 30 kDa – 6 MDa mass range, depending on the mass photometer (30 kDa – 5 MDa with the TwoMP, 500 kDa – 6 MDa with the Samux). 

    Most published studies have applied mass photometry to proteins – to study protein-protein interactions (Higuchi, et al. 2021), protein oligomerization mechanisms (Naftaly, et al. 2021) and characterize protein sample stability (Nuber, et al. 2021).  

    Mass photometry has also been used successfully to study heteromolecular interactions such as DNA-protein interactions (Hickman, et al. 2020).  

    Mass photometry can be applied to nucleic acids, enabling the detection and quantification of nucleic acids at sub-picomolar concentrations (Li, et al. 2020) as well as the measurement of the length and integrity of RNA samples (Camperi et al. 2024, Schmudlach et al. 2020).  

    Mass photometry has also been applied to vesicles and micelles (Lebedeva, et al.  2020), and polysarcosine star polymers for drug delivery (England, et al. 2020).  

    The linear correlation between the contrast (the signal measured in mass photometry) and molecular mass holds for a wide variety of biomolecules (Young, et al. 2018) – making mass photometry a universal tool for biomolecules and particles in solution. The precise linear relationship between the contrast and mass may differ for each class of molecule, however, requiring calibration with an appropriate standard (e.g. a protein calibrant for measuring proteins, a DNA calibrant for measuring DNA, etc.).  


    How is mass photometry used?


    With mass photometry, you can measure the molecular mass of single biomolecules, oligomers, polymers, macromolecular assemblies, nanostructures and small viral capsids (of e.g. adeno-associated viruses, AAVs). 

    You can also quantify the oligomerization and aggregation of biomolecules (Naftaly, et al. 2021, Balakrishnan et al. 2024), characterize sample heterogeneity (Olerinyova, et al. 2021, Sonn Segev, et al. 2020), monitor the stability of sample components (Nuber, et al. 2021), and study the effects of molecular or experimental modifications on sample integrity (Bertosin, et al. 2021). 

    Mass photometry is especially valuable for studying biomolecular interactions – including protein-protein interactions (Higuchi, et al. 2021; Soltermann, et al. 2020) and protein-nucleic acid interactions (Hickman, et al. 2020; Acharya, et al. 2021). Mass photometry makes it possible to determine stoichiometries in biochemical reactions (Xu et al., 2024) , and quantify affinities and rate constants in molecular interactions (Wu and Piszczek 2020; Soltermann, et al. 2020). 

    Thanks to this versatility, mass photometry is seeing use across a wide range of different applications, such as assessing antibody affinity and aggregation (den Boer et al. 2021, Cramer et al. 2023), characterizing membrane proteins (Olerinyova, et al. 2021, Dodge et al. 2024) and supporting structural studies (Vasquez et al. 2023, Crowe et al. 2024). 

    Mass photometry is also widely used to characterize AAV samples (Wu, et al. 2021, Wagner et al. 2023, Wagner et al. 2024, Ebberink et al. 2024). Macro mass photometry, a newer technology that builds on the principles of mass photometry, characterizes samples of larger viral vectors (e.g. adenovirus), virus-like particles (VLPs) and lipid nanoparticles (Wu et al. 2025). 

    Although mass photometry was introduced relatively recently (in 2018), its range of applications has expanded rapidly as users discover the technology and its versatility. For an up-to-date list of publications citing mass photometry, visit our publications page. 


    Further resources

    If you would like to learn more about the biophysics behind mass photometry, we recommend the following resources: 

    Webinar: Measuring molecules with light by Prof. Philipp Kukura, University of Oxford   

    Prof. Kukura, who led the development of mass photometry, explains the principle of mass photometry and talks you through the steps that he and his team of scientists took while developing mass photometry as an analytical tool for biomolecules. You can also hear about examples of mass photometry applications.  

    Webinar: Mastering protein characterization with mass photometry: Key insights & applications by Tomás de Garay, Refeyn

    Tomás de Garay, Product Manager at Refeyn, describes how mass photometry is transforming protein characterization. He provides a brief introduction to the technology, its applications, and how it compares to analytical techniques like cryo-EM, SEC and mass spectrometry. Tomás then answers questions about technical aspects and practical considerations.

    Mass photometry handbook

    How does mass photometry offer fast, accurate insights – in solution and label free? This handbook explains the underlying principles, strengths and limitations of the technique. 

    References

    Acharya A, Kasaciunaite K, Göse M, Kissling V, Guérois R, Seidel R, et al. Distinct RPA domains promote recruitment and the helicase-nuclease activities of Dna2. Nat Commun. 2021 Nov 11;12(1):1–15. [Link].

    Balakrishnan, S. et al., 2024. Structure of RADX and mechanism for regulation of RAD51 nucleofilaments. Proceedings of the National Academy of Sciences, 121(12), p.e2316491121 [Link].

    Bertosin, E. et al., 2021. Cryo-Electron Microscopy and Mass Analysis of Oligolysine-Coated DNA Nanostructures. ACS Nano, p. 15(6):9391–9403. [Link].

    Camperi, J., et al. 2024. Comprehensive impurity profiling of mRNA: evaluating current technologies and advanced analytical techniques. Analytical Chemistry, 96(9), pp.3886-3897. [Link].

    Cole, D. et al., 2017. Label-Free Single-Molecule Imaging with Numerical-Aperture-Shaped Interferometric Scattering Microscopy. ACS Photonics, p. 4(2): 211–216. [Link].

    Cramer, D.A., Franc, V., Heidenreich, A.K., Hook, M., Adibzadeh, M., Reusch, D., Heck, A.J. and Haberger, M., 2023, December. Characterization of high-molecular weight by-products in the production of a trivalent bispecific 2+ 1 heterodimeric antibody. In MAbs (Vol. 15, No. 1, p. 2175312). Taylor & Francis. [Link].

    Crowe, C. et al., 2024. Mechanism of degrader-targeted protein ubiquitinability. Science Advances, 10(41), p.eado6492. [Link].

    den Boer, M.A. et al., 2021. Comparative analysis of antibodies and heavily glycosylated macromolecular immune complexes by size-exclusion chromatography multi-angle light scattering, native charge detection mass spectrometry, and mass photometry. Analytical Chemistry, 94(2), pp.892-900. [Link].

    Dodge, G.J. et al., 2024. Mapping the architecture of the initiating phosphoglycosyl transferase from S. enterica O-antigen biosynthesis in a liponanoparticle. Elife, 12, p.RP91125. [Link].

    Ebberink, E.H. et al., 2024. Probing recombinant AAV capsid integrity and genome release after thermal stress by mass photometry. Molecular Therapy Methods & Clinical Development, 32(3). [Link].

    England, R. M. et al., 2020. Synthesis and Characterization of Dendrimer-Based Polysarcosine Star Polymers: Well-Defined, Versatile Platforms Designed for Drug-Delivery Applications. Biomacromolecules, p. 21(8):3332–3341. [Link].

    Hickman, A. B. et al., 2020. Casposase structure and the mechanistic link between DNA transposition and spacer acquisition by  CRISPR-Cas. eLife, p. 9:e50004. [Link].

    Higuchi, Y. et al., 2021. Engineered ACE2 receptor therapy overcomes mutational escape of SARS-CoV-2. Nature Communications, p. 12:3802. [Link].

    Li, Y., et al, 2020. Single-molecule mass photometry of nucleic acids. Nucleic Acids Research, p. e97. [Link].

    Naftaly, A., et al, 2021. Revealing Advanced Glycation End Products Associated Structural Changes in Serum Albumin. ACS Biomaterials Science & Engineering, p.  7(7):3179–3189. [Link].

    Nuber, F. et al., 2021. Biochemical consequences of two clinically relevant ND-gene mutations in Escherichia coli respiratory complex I. Scientific Reports volume, p. 11:12641. [Link].

    Olerinyova, A. et al. 2021. Mass Photometry of Membrane Proteins. Chem 7, 224–236. [Link].

    Schmudlach, A. et al. 2025. Mass photometry as a fast, facile characterization tool for direct measurement of mRNA length. Biology Methods and Protocols, 10(1), p.bpaf021. [Link].

    Soltermann, F. et al., 2020. Quantifying Protein-Protein Interactions by Molecular Counting with Mass Photometry. AngewandteChemie International Edition in English, pp. 59(27):10774-10779. [Link].

    Vasquez, S. et al., 2023. Structural and biochemical investigations of a HEAT-repeat protein involved in the cytosolic iron-sulfur cluster assembly pathway. Communications Biology, 6(1), p.1276. [Link].

    Wagner, C. et al., 2023. Quantification of empty, partially filled and full adeno-associated virus vectors using mass photometry. International Journal of Molecular Sciences, 24(13), p.11033. [Link].

    Wagner, C. et al., 2024. Automated mass photometry of adeno-associated virus vectors from crude cell extracts. International Journal of Molecular Sciences, 25(2), p.838. [Link].

    Wu, D. & Piszczek, G., 2020. Measuring the affinity of protein-protein interactions on a single-molecule. Analytical  Biochemistry, p. 592:113575. [Link].

    Wu, J. et al., 2025. Characterization of Lipid Nanoparticles Using Macro Mass Photometry: Insights into Size and Mass. Analytica Chimica Acta, p.343944. [Link].

    Xu, J., Brown, N.J., Seol, Y. and Neuman, K.C., 2024. Heterogeneous distribution of kinesin–streptavidin complexes revealed by mass photometry. Soft matter, 20(28), pp.5509-5515. [Link].

    Young, G. et al., 2018. Quantitative mass imaging of single biological macromolecules. Science, pp. 360(6387):423-427. [Link].

    Author: Catie Lichten, PhD, Refeyn Scientific Communications Manager